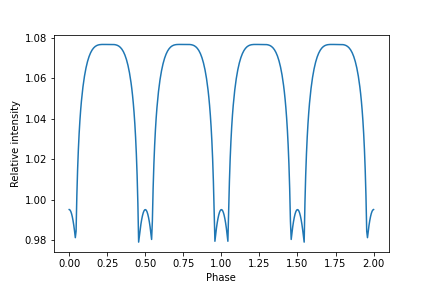
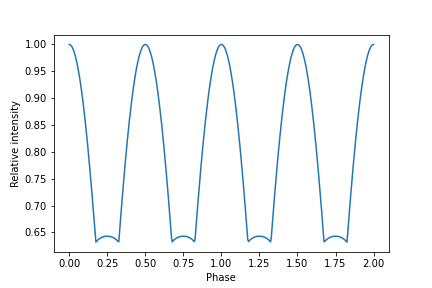
Lightcurve produced by two opposite hotspots
Here we model lightcurves produced by two opposite hot spots following article [1].
We import Magpies and numpy, math and matplotlib packages which
are typically handful:
from magpies import *
from atmos import *
import numpy as np
from math import *
import matplotlib.pyplot as plt
We initialse basic neutron star properties.
## Radius and mass of neutron star
## (a) panel
Rns = 10  ## km
Mns = 1.8 ## M_solar
Further we create a surface thermal map with which is filled with zeros. We place two
hot spots (areas with temperature \(T = 10^6\) K) at opposite locations.
You can find more details about the atmos.Tmap.__init__ in Initialising the surface thermal map.
Tm = Tmap (usage='zero')                              ## Surface thermal map filled with zeros
Tm.Ts[0, int(len(Tm.theta)/2)] = 1e6                  ## First hot spot located at phi = 0, theta = pi/2
Tm.Ts[int(len(Tm.phi)/2), int(len(Tm.theta)/2)] = 1e6 ## Second antipodal hot spot, phi = pi, theta = pi/2
Next, we create array where we store all rotational phases. We also compute the lightcurve
using function magpies.lightcurve().
phases = np.linspace (0, 4*pi, 400) ## Phases where we compute the lightcurve
intens = lightcurve (Tm, Rns, Mns, phases, 0, pi/2) ## last two arguments are chi and inclination

phase = np.asarray(phases) / pi / 2 ## converting phase angle to phase

inten = np.asarray(intens) / np.mean(intens) ## transforming to absolute values

plt.plot (phase, inten+0.05) ## small shift in y axis because I plot the total intensity and not only Dcos \alpha factor

It is possible to repeat this exercise changing the compactness of neutron star. So, here I change the radius and mass and repeat the calculations of the lightcurve. The surface thermal map stays exactly the same.
## Radius and mass of neutron star
Rns = 13  ## km
Mns = 1.4 ## M_solar
intens = lightcurve (Tm, Rns, Mns, phases, 0, pi/2) ## last two arguments are chi and inclination

phase = np.asarray(phases) / pi / 2 ## converting phase angle to phase

inten = np.asarray(intens) / np.max(intens) ## transforming to absolute values

plt.plot (phase, inten)
plt.xlabel('Phase')
plt.ylabel('Relative intensity')
plt.savefig('lightcurve_13_14.png')
