Initialising the surface thermal map
The code provides a few distinct ways to create surface thermal map. Here we consider all important options.
Using NS atmospheric model
The simplest way to initialise a new surface temperature distribution
is by using a numerical fit which relates deep crust temperature with the top of the
atmosphere temperature assuming axi-symmetric dipolar magnetic field.
These theoretical fits are implemented in atmos.NS_atmosphere
class. We start with importing python packages which will be required.
from magpies import *
from atmos import *
import numpy as np
from math import *
After this we choose essential parameters of the neutron star such as its radius, mass (to compute
compactness), deep crust temperature and strength of the polar magnetic field.
We additionally compute the free fall acceleration for selected radius and mass using
method magpies.g14.
Rns = 12  ## km
Mns = 1.4 ## M_solar
Tb = pow(10, 7.1730)  ## K
Bp = 1e11 ## G
g14c = g14 (Rns, Mns)
Now we have all required parameters to initialise the atmos.NS_atmosphere class.
atm_iron_2003 = NS_atmosphere ('Potekhin_2003_iron', g14c, Tb, Bp)
We will pass the member of this class to our atmos.Tmap class:
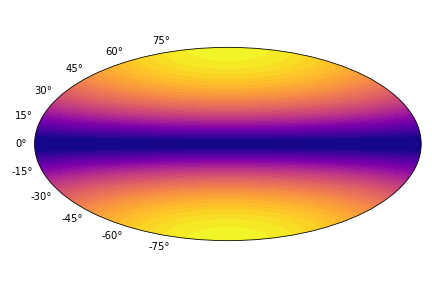
Tm = Tmap (usage='NS_atm', ns_atm=atm_iron_2003)
This class creates thermal map using the atmospheric model and \(N_\theta = 100\) and \(N_\phi = 99\) by default. It is possible to pass different mesh size as the argument.
Tm = Tmap (usage='NS_atm', ns_atm=atm_iron_2003, Ntheta = 20, Nphi = 10)
The result is the class member which contains the following components: Ts, theta, phi. The Tm.Ts is
two dimensional array containing temperatures at each point of the grid, theta and phi are
one dimensional arrays containing latitudes and longuitudes of grid points. This class
also has a method atmos.Tmap.Ts which allows to plot and store the
surface thermal map in Aitoff projection.
Tm.plot_Ts()

Creating isolated hot spots
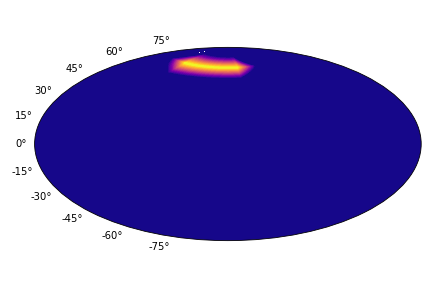
Isolated hot spots can be created by direcly editing Tm.Ts array. So,
it is possible to initialise empy atmos.Tmap class with necessary size and add
a hot region \(T = 10^6\) K close to the pole.
Tm = Tmap (usage='zero',  Ntheta = 20, Nphi = 10)
Tm.Ts[2, 2] = 1e6
Tm.plot_Ts()

Here we work with low resolution surface thermal map that is why the single pixel hot spot seems relatively large. Poisiton and size of hot spots needs to be coordinated with the surface thermal map resolution.
Constracting the surface thermal map
If a surface thermal map is stored in some external
file, it is possible to pass this map as parameters
while creating the atmos.Tmap class.
Tm = Tmap (usage='Ts', theta=theta_list, phi=phi_list, Ts = Ts)
The array storing the map should have the following structure \(\mathrm{Ts}[\phi, \theta]\). All functions assume that surface mesh is uniform.